There is a very high likelihood that most stock market participants will be in the red or even deep underwater so far this year. 2022 is the year of the bear market, right? Well, not quite right! What many don’t believe and can’t explain is why in many cases individual portfolios have actually lost even disproportionately more than the indexes. Today, I’ll show you how the crash proceeded, what you can learn from it, and what you might expect next.
Most people will agree that the last three years in stock market investing went more or less as follows:
- after a strong year 2019, stocks first crashed so fast like never before, but also recovered like never seen in 2020 – it felt like the buying opportunity of the decade!
- 2021 was supposed to be even a better year; zero interest rates, economies recovering with strong growth rates as well as everything related to technology taking over the world – that was the mantra
- this year 2022, however, is quite the opposite – very painful and many got caught offguard
One of the most asked questions currently seems to be when this bear market will end (the other being when technology stocks will resume their runs up). And rightly so, because no one likes sitting on losses. The longer it takes, the more painful it becomes in many cases.
However, there was no such a thing like “first everything up, then everything down together”.
This could not be further from the truth.
Also, it is unlikely that all stocks will crash from here on to the basement like in 1929.

While more and more voices are saying at least since summer “the bottom is finally in” while their stocks are making new lows and more recently “the FED will slow down the pace of interest rate hikes to save the markets”, I think something will happen that again will catch the majority on the wrong foot.
Seldom do markets develop in consensus with the broad opinion or expectation.
In today’s Weekly, we will first take a look back, to understand how the corrections and even individual brutal crashes progressed. Then, I will discuss what should be expected next and why indexes likely will not experience a hefty 1929-style crash with a free fall of 50% or more.
Have you already signed up for my free weekly newsletter to receive alerts about articles like this? If you are visiting my site from a mobile device, you will find the newsletter formular below, at the end of this article.
As a bonus, you receive a free research report from me, shortly after you signed up!
The four phases of the current bear market
Looking just at the indexes, one could assume that after the preliminary top in 2019, markets crashed in 2020, only to rapidly rise again until the end of 2021. Only some lockdown-related “casualties” like airlines, cruise lines or restaurants didn’t want to participate in the upswing.
The majority, however, climbed up, many even to new all-time highs, as also the indexes did. What followed so far, has been the bear market of 2022.
This could be a short summary of the last three years. But it is not correct.
It heavily depends on where you have been invested. Not only could your portfolio be 2x or even 3x more under water than the indexes.
To the contrary, you could also have easily sailed around the zero without losing anything. Of course, you could have also made really good gains this year, had you invested in energy or food-related stocks, no question.
How come then the conception that only 2022 is the year of the bear market?
The answer: there was a certain order of things with different impacts to happen behind the scenes, i.e. concerning the indexes.
As you might know from my article “Hidden risks of ETF investing – how to invest instead” (see here), the indexes we see everyday, are not equal-weighted. This means there are always some stocks that dominate an index while others never play a major role, even if their stocks doubled or tripled.
But there are also times, like the present one, when the fate of an index depends heavily on the direction its dominant constituents take.
Especially since the crash and rebound of 2020, the big technology companies have played this role remarkably well. Companies like Apple (ISIN: US0378331005, Ticker: AAPL), Microsoft (ISIN: US5949181045, Ticker: MSFT), Alphabet (ISIN: US02079K3059, Ticker: GOOGL), etc. got so unnaturally big, that they masked the massacre that was happening in the second and third rows.
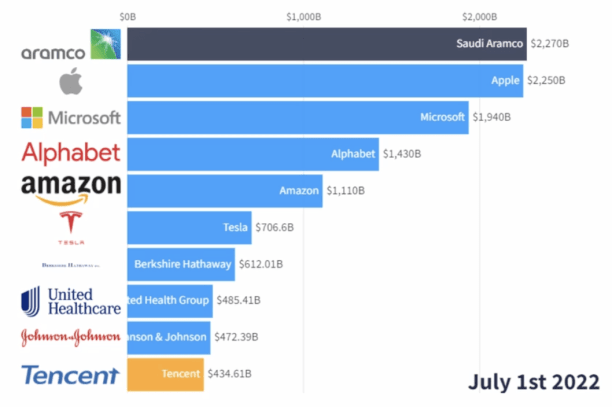
The chart above already shows the biggest companies a half year after the current bear market started, but the outcome is still the same. A few very dominant, mostly tech-related companies, (still) dominate the markets and indexes.
You can also have a look here at the factsheet of the NASDAQ 100, where the top 10 companies make 50% of the index. Even in the broader S&P 500 the top 10 make 26% of the whole index (see here, click on factsheet USD).
And so first – namely already at the start of 2021 – only investors with exposure to small technology stocks got shaved with a blunt blade. The razor burn still hurts until today. Those are the ones I thought of when writing above of 2x or 3x deeper losses compared to the indexes.
The previous mania in small-cap technology stocks took such forms that one can only grab oneself by the head today. Every little bit of common sense was lost. Hope became the main investment thesis. Maybe also mixed into that a portion of greed.
Fundamental investors looking at business models and valuations were idiots from yesterday while “visionary” companies that only claimed to have something in common with “technology” or “artificial intelligence” were the rising stars.
It sounds as banal as it is, but what goes up this way, must come down.
And because of many stocks not only doubling or tripling, but even going up parabolically 5x, 10x or more in just a few months without the underlying fundamentals, valuations shot up to unsustainable levels.
Many companies were valued in a way that not only everything had to evolve down the road as promised, but also the stocks were fully valued based on a decade into the future.
Where should the upside come from? Again, assuming EVERYTHING went on without being too optimistic, i.e. without downward corrections or slower growth as thought first.

Here are a few examples of the first wave – all measured by eye:
- WIX.com (ISIN: IL0011301780, Ticker: WIX): the company offers cloud-based website building solutions (the market leader being WordPress, which I use). WIX ist still not profitable until this day. It traded at 15x revenues at the top and since then came down from more than 300 USD per share to 70 USD.
- Teladoc Health (ISIN: US87918A1051, Ticker: TDOC): The said-to-be market leader in telemedicine or “virtual healthcare services”. The business has never thrown off a penny, lost more than 90% from its peak and was valued at hot 33x sales. One day I even remember they posted a loss per share of 30 USD having a share price of only 50 USD (!) – this was a hefty asset impairment on a prior takeover deal.
- C3.AI (ISIN: US12468P1049, Ticker: AI): a company that claims to be doing something with artificial intelligence – of course still not profitable – fell slightly after its IPO from over 150 USD per share to the current around 12 USD. It was valued at a sales multiple of 81x – bargain, wasn’t it?
- the list could go on and on…
Please note that they were valued by sales, not earnings multiples!
All these companies have in common that they promised the world and thus got bid up until they crashed down due to unsustainable valuations and also disappointing business results.
Later on during 2021, the next wave of stocks was caught. This time the victims were somewhat larger companies that also in many cases had something to do with technology with also absurd valuations:
- DocuSign (ISIN: US2561631068, Ticker: DOCU): a business offering an interesting solution for signing all sorts of documents digitally from everywhere – even highly important ones. The rest is the same as above. No profitability in sight and a 35x sales multiple at the top. The stock is down from 300 USD to 42 USD currently.
- Shopify (ISIN: CA82509L1076, Ticker: SHOP): One of my favorite gaga-stories. The products seem to be good and frequently used for building online shop and payment systems. However, every story has a limitation. Shopify is – of course – not profitable and a turn is not in sight. The stock flew so high that a single one cost 1,700 USD, before it got split 10:1. In new terms, the high was at 176 USD. It changes hands currently for 32 USD (it went as deep as 23 USD already this year). The sales multiple at the top was 56x, however, some time before the stock peaked, because revenue grew strongly and the stock managed to keep up for some time.
- Cloudflare (ISIN: US18915M1071, Ticker: NET): The company offers cloud-based online security solutions. Sometimes you get checked by Cloudflare when you enter websites using this service. The company is also not sustainably profitable. Its stock corrected from 221 USD to 39 USD. However, the valuation was one of the most extreme I could find. At the top, the stock traded temporarily at over 100x sales.
- etc.
Many inexperienced tech investors argue than one has to value these types of stocks by their sales multiple, because the underlying companies invest everything they have raised (note: not earned) in capital back into their businesses to grow.
This argument seems very logic. But don’t get fooled by this.
Sales multiples are seldom a good idea, not even to mention when they rise into double digits. Remember that we are talking about companies with no current earnings / cash flows and no clear sign for when this would flip.
The risk and and uncertainty about the future are very high!
Please read attentively the following quote from the former CEO of Sun Microsystems from the Dotcom era about the stupidity of paying even a 10x sales multiple (Sun Microsystems was a former computer technology company that among others invented the java programming language and got acquired by Oracle (ISIN: US68389X1054, Ticker: ORCL) in 2010):
At 10 times revenues, to give you a 10-year payback, I have to pay you 100% of revenues for 10 straight years in dividends. That assumes I can get that by my shareholders. That assumes I have zero cost of goods sold, which is very hard for a computer company. That assumes zero expenses, which is really hard with 39,000 employees. That assumes I pay no taxes, which is very hard. And that assumes you pay no taxes on your dividends, which is kind of illegal. And that assumes with zero R&D for the next 10 years, I can maintain the current revenue run rate. Now, having done that, would any of you like to buy my stock at $64? Do you realize how ridiculous those basic assumptions are? You don’t need any transparency. You don’t need any footnotes. What were you thinking?
Scott McNealy, former CEO of Sun Microsystems
The wave of exploding unprofitable companies led temporarily to a new paradigm. Whereas “old-school” investing approaches using common sense or evaluating fundamentals and valuations were laught at and buried in the ground (think of Warren Buffett), uncalculated and reckless risk-taking adventures seemed to be the only game in town (think of Cathie Wood).
The former looked like the stupid one barely performing on its own and being additionally left behind by the spectacular performance of the latter.
We know how that ended.
There was even a chart going around that showed the underperformance of Buffett’s Berkshire Hathaway stock (ISIN: US0846701086, Ticker: BRK.A) in comparison to Cathie Wood’s ARK Innovation Fund (ISIN: US00214Q1040, Ticker: ARKK).
I recreated it myself. Here is the chart over the last five years:

While Buffett sailed through all three corrections (2018, 2020 and 2022) with a plus of 59% over five years, Wood’s ARK ETF has not moved effectively, despite having gone up more than 4x until early 2021. Wow!
Over the last rolling twelve months Buffett has achieved +0.8% – the ARK Fund is down by nearly 72%. The latter would need to nearly make 4x just to reach their former high again.
I don’t know how you assess the likelihood, but for me this seems very uncertain.
The more stocks crash percentage-wise, the disproportionately higher the returns need to be just to recover to break even!
| Your potential loss | Return needed just to break-even |
| –10% | +11.1% |
| –25% | +33.3% |
| –50% | +100% (!) |
| –90% | +900% (!!) |
This is the reason why a good investor has his emotions under control and is able to lose as little as possible during a bear market. It is not the time to be overly courageous and buy every dip in the hope of a turnaround, but to keep a cool head.
And to focus on fundamentals, using the processor between one’s ears.
When I started my Twitter account, I tweeted why most of the former bubble stocks won’t see their all-time highs again:

My initials thoughts about small cap tech stocks have not changed, but even become firmer since.
With this overview of the first two waves of the crash – that affected the indexes way less – let’s now turn on to those companies that held up relatively well for most of 2022 until recently and which also held up the indexes higher than most individual portfolios.
There is no denying that when ten stocks make up 50% (NASDAQ 100), respectively 26% (S&P 500) of a certain basket, that both – stocks and indexes – probably will share the same fait down the road.
At least there will be to some extend a very high correlation.
Here is a brilliant chart that quickly shows what has happened sector-wise, plus including the biggest representatives as well as the top and flop performers on an individual basis by name:

From the sectors technology, consumer cyclical and communication services (where the Big Tech companies are hidden) we see that all lost something around 20% to 30%. This is also the thumb size of the performance of the indexes.
Note that this chart goes only until the end of September, hence without taking into account the current earnings season with first a strong rebound during October with many rising (or should I say “bouncing”?) stocks and then some declining heavily like Amazon (ISIN: US0231351067, Ticker: AMZN) or Meta (ISIN: US30303M1027, Ticker: META) after disappointing with slowing growth and crashing earnings.
At least on a business level, things seem not to be supportive for the Big Tech companies:
- all have a certain degree of cyclicality to them, i.e. they depend on consumer spending which is depressed with inflation at 40-year highs (in Germany even at 70-year highs!)
- Apple has problems with “its” Chinese Foxconn factories where lockdowns disrupt production (see here and here)
- all of them either are laying off employees massively or at least have stopped expanding (see here, here and here)
Here you see a graphic how the market caps of these companies went south by early November:

Unlike some “value hunters” who see attractive valuations all the way after prices dropped (and saw them for example when Meta’s price was around double of what it is now after already halving from its high), I would not rush to buy any of them.
Each of them has its own challenges and still ambitious valuations for muted growth prospects. For example see one of the newest headlines:

When the overall public perception is that some stocks or sectors are infallible – just that happens. New buyers become scarce and the stocks nosedive.
Plus, what I really dislike is their capital allocation “skills”. Most of the companies aggressively bought back their own shares when earnings were the strongest. However, also prices were the highest.
All in all, these companies (namely: Microsoft, Meta and Alphabet) wasted several hundreds of billions in USD for repurchasing their stocks at way higher prices than they currently are available for.
To sum it up until here, I think that the Big Tech stocks will disappoint somewhat further down the road and due to their overall weightings take the indexes with them.
However, what we likely won’t see is a full-blown crash in the ballpark of 50% in the indexes and also likely not in the Big Techs, however, individual exceptions are always possible. For example, I wouldn’t be so sure that Meta will ever matter much again and ever come back…
At some point, valuations of most those stocks will become attractive again and the sentiment too pessimistic.
And there is another reason: They are big enough to absorb vast amounts of capital fleeing bonds and oversees markets (declining currencies and bond crashes, anyone?). This big tickets will be used to park money, hence you likely won’t see Apple’s stock trading at a single digit PE ratio again for some time.
Keep in mind that I might be a biased Apple-fan due to using some of their products. But there are not many stocks big enough and thus able to absorb just parts of the way larger bond markets.
There is a forth type of stocks that – to be precise – consists of two subcategories.
They both have in common that they performed remarkably well so far this year! Most of them have not only not lost, but in many cases their share prices are at or around their all-time highs, as if there never was a bear market!
It is important to understand, because this one dimensional thinking and looking at things is a distortion from reality!
It’s worth to take a look at this group, because I expect one of them at least to underperform or maybe even start a correction themselves as the last domino of the whole chain – the “safe haven stocks”.

I am talking about consumer staples which describe companies with necessary everyday products like food, drugs, household goods or even some payment companies.
Here is a selected list of ten companies with different everyday products and thus strong demand all the way which have done comparatively well so far this year:
| Company | YTD return so far (08. November 2022 closing) | valuation (Enterprise Value / Free Cash Flow) |
| Visa ISIN: US92826C8394 Ticker: V | –9% | 28x |
| Mastercard ISIN: US57636Q1040 Ticker: MA | –12% | 30x |
| General Mills ISIN: US3703341046 Ticker: GIS | +18% | 18x |
| Procter & Gamble ISIN: US7427181091 Ticker: PG | –16% | 34x |
| Johnson & Johnson ISIN: US4781601046 Ticker: JNJ | +1% | 25x |
| Eli Lilly ISIN: US5324571083 Ticker: LLY | +35% | 60x |
| Amgen ISIN: US0311621009 Ticker: AMGN | +29% | 18x |
| AutoZone ISIN: US0533321024 Ticker: AZO | +22% | 29x |
| Dollar General ISIN: US2566771059 Ticker: DG | +7% | 79x |
| Coca-Cola ISIN: US1912161007 Ticker: KO | +1% | 29x |
Assuming you have started the investing year 2022 with this defensive portfolio on an equal-weighted basis and only from the perspective of an USD-investor, your return would have been so far +7.6% – only with one-time purchases at the set-up and without counting dividends, all listed companies pay with the exception of AutoZone (which uses all free cash flow to repurchase its stock).
“Where is the bear market?” would have been the question, then.
All in all, 126 companies (around 25%) in the S&P500 index are in positive territory this year (see here), per 07. November 2022!
When you look closely at the table above, you will notice in many cases very ambitious valuations. Most of these companies are only growing with single digit numbers and also many will have to refinance their debts at higher interest rates.
That makes them vulnerable when the tide turns. Also, I would not expect massive dividend increases in many cases. I would expect them to be under the inflation rate.
However, to be fair, they have done a good job so far, for sure. But the upside is very limited. Risks are certainly not exaggerated, especially on the valuation side.
No stock or sector is infallible!
With that, let’s jump straight to the second part of the fourth group of the winners so far: Energy companies.
Because I have already written the following articles about energy and also the ongoing sector rotation (I would encourage you to read in case you haven’t done so far), I will only add new input to stress my point:
1. Hidden risks of ETF investing – how to invest instead
2. How to beat the bear market – inflation, stagflation, recession
3. Are evil energy (oil) stocks already priced too ambitiously for a recession?
In the last week, I came along the conference call transcript of Hess Corp. (ISIN: US42809H1077, Ticker: HES), an oil producer. It is always interesting to hear or read what their CEO, John Hess, has to say about the status of the industry.
Here are some quotes (and fat marks by me) of his prepared remarks:
Global oil demand has returned to pre-COVID levels of approximately 100 million barrels per day. As we look to 2023, even with a recessionary environment and a slowing world economy, we expect global oil demand to grow by at least one million barrels per day driven by China reopening its economy and an increase in global air travel.
John Hess – Hess Corp. Q3 2022 earnings call transcript
Oil supply, on the other hand, continues to struggle to keep up with global demand. Global oil inventories are approximately 300 million barrels less than pre-COVID levels, and there is very little spare production capacity in the world. Oil markets were tight even before Russia invaded Ukraine and are expected to get even tighter this winter with the potential for further sanctions on Russian oil exports.
The world is facing a structural supply deficit and significantly more global oil investment is needed. According to the International Energy Agency, a reasonable estimate for the global oil and gas investment needed for supply to meet demand is approximately $500 billion each year over the next 10 years. The last five years have seen significant underinvestment, which will tighten supply as global oil demand grows in the years ahead.
[…]
(see here)
To sum it up: We have demand for oil not falling, supply not rising, inventories at multi-year (in some cases even decade) lows and OPEC(+) regaining strength again. At the same time the US will have to refill their strategic oil reserve – rather sooner than later.
Plus, valuations of this disliked sector are still not high, assuming the price of oil does not fall sustainably which I cannot see, given the facts.
This way, there is still value in the markets to be found. Energy is one such sector. But I promise to keep both my eyes and ears open for you, soon with a new research report.
Conclusion
The collapse in the markets (and behind the curtain since early 2021) has so far happened in three phases. First the smallest tech stocks collapsed, followed by bigger ones. During 2022 many other businesses were caught, including the Big Tech stocks.
“Finally, the last part”, one could think. However, what has not fallen so far, are many consumer staples and energy stocks.
I expect the former “safe havens” to be ripe for a correction, soon, due to their high valuations and slow growth during a likely recessionary environment with high inflation rates. This could be the last domino to fall and to scare the majority out of the markets, providing a final sell-off.
The latter, energy stocks, are still disliked and hence not highly valued, in many cases offering attractive dividend yields – supported by cash flows on all-time highs. Maybe think of tobacco stocks during the second half of the 20th century.
What I do NOT expect is a total collapse of all stocks and sectors. The real problems can be found in the bond markets and in real estate which by themselves had way higher valuations and are way more sensitive to interest rate hikes.
Also, at some point the indexes should stop falling, because the stronger stocks will start to have a greater weighting overall.
For my German-speaking readers (but also for everyone else, of course 😉 ), here’s a recent YouTube appearance of mine. I did a livestream with Daniel from InvestFlow. We talked about several results of the earnings season, the interest rate environment including an outlook as well as some other topics.

My Premium Members receive 8 exclusive research reports with interesting investment cases per year plus updates. I have already published two exclusive reports and a full free report (for those who sign up for my free weekly newsletter).
If you haven’t signed up just yet, consider doing so for just 99 EUR / year to support my work by clicking here.