Operating or net income, adjusted operating or net income, earnings per share (EPS), adjusted EPS and the price to earnings (PE) ratio are commonly used to assess a company’s business results and to value it. They are also often used as headline numbers and proof of performance by the companies themselves. However, there is a rising trend of decreasing “earnings quality” – an indicator that neither the economy is doing pretty well, nor many companies.
Summary and key takeaways from today’s Weekly
– Reported earnings should not automatically taken at face value – especially not the headline numbers as they are highlighted for a purpose.
– You should compare reported earnings with the (free) cash flow generation.
– Better be cautious or even avoid companies with high valuation multiples, high debt and weak cash flow generation.
I likely won’t tell you a secret that the figures mentioned above in the intro section are broadly used as indicators to assess the health and well-being of a company.
Earnings, also called profits, “the bottom line” or just “results”, are viewed upon to get a feeling for how much value a business generated. If you know how profitable the business is and how predictable the earnings are, you can give it a multiple to value the whole company. For example, a price to earnings (PE) ratio of 20x means the whole business is valued with 20 times its last earnings on a yearly basis.
The reciprocal value of the PE ratio gives you the expected earnings yield, however, without factoring in growth – in this case 5% (1 / 20). The lower the PE ratio, the higher the expected earnings yield – but as said, without looking at growth which would increase the earnings yield on your cost basis with time.
That’s the broad-brush theory and also commonly used practice of how businesses and especially stocks are looked upon.
Certainly one advantage of using this method is that it is quickly done (if understood).
But unfortunately, herein lie some hidden dangers and potentially big disappointments, as the “earnings quality” has been suffering over the last quarters. Even to such an extent that we are now seeing the worst earnings quality since at least 1990, according to a Bloomberg article.

But what is earnings quality and why is it important?
As my readers know, I am not only looking at headline numbers. Likewise, I am often stressing the importance of cash flows which are a part of the reported earnings – for me and likely for the well-being of every company the single most important one!
However, more and more companies are reporting lower quality earnings.
Despite “okay” (adjusted) operating or net income (or EPS, maybe even pushed up a bit by buybacks), there are more and more surprises arising. Otherwise rather stable companies suddenly get crushed by 10%, 15% or even more after the release of their business results – in one trading session.
The reason is that their cash flows are weak or even horrible.
Today, we are going to look behind this facade. You’ll learn what is absolutely necessary to look at to not be caught on the wrong foot. I will also discuss a recent example of reported earnings and the following sell-off of a company that was viewed as a defensive “recession investment”.
Have you already signed up for my free weekly newsletter to receive alerts about articles like this? *
As a bonus for signing up, you receive a free research report from me!
* Visitors of my site with a mobile device will find the newsletter formular at the end of this article.
I am offering a reader-supported service. If you like my work and want to support me and my blog, please consider becoming a Premium or Premium PLUS Member, where you will get exclusive research reports with my best investment ideas.
What you need to know about “earnings quality”
I am starting straight with a quote of the first two paragraphs from the Bloomberg article (highlights by me):
In telling their stories about how the future is bright for stocks, bulls point to solid earnings to justify the optimism. But cracks are forming in that narrative — in the trajectory of profits, and just as worryingly in the makeup of the profits themselves.
In a potentially ominous development, earnings across US industries have started to expand noticeably faster than cash is coming in the door. Income at S&P 500 companies, adjusted for amortization and depreciation, topped cash flows from operations by 14% in the year through September, according to data compiled by UBS Group AG that excludes the index’s financial and energy firms.
source: Bloomberg (see here)
They also mention that the number of loss making business is near a record-high. So, something does not seem right.
My goal isn’t to give a comprehensive accounting lecture.
However, a basic understanding of some crucial elements and setting screws is necessary. Most news outlets and even many pretend-analysts don’t bother with what you will read today. And yet it is not difficult. It just takes a few minutes to grab the original publications and scroll to the appropriate sections.
You will certainly have heard the phrases “cash is king” or “cash flow is king”.
There is not only a certain element of truth in them. I would go even as far as claiming that a company can starve to death at the outstretched arm, if it runs dry on cash. No matter the sales or “earnings”.
Personally for me, only looking at reported earnings alone – especially the “adjusted” ones – is just as dumb and ignorant as thinking that a nominally higher share price means a company is expensive, while a penny stock is automatically perceived cheap.
Cash or cash on hand is the current total amount of liquid means available. Besides pure cash, you can often find short-term investments with a maturity of less than one year. These two are often put together as one. That’s fine in most cases.
Cash flow from operations (the net value of cash in and cash out) tells you how much cash flowed into the business’s coffers during the reporting period out of its business activity.
A positive cash inflow then increases the cash position (after having subtracted all core expenses, but also payouts like investments into the business, dividends, buybacks, debt repayments and so on – the “real net” so to speak).
Needless to say that you will want to make sure that both are as high as possible.

The former (cash) can be found on the balance sheet.
The latter (cash flow) has a separate statement, called the cash flow statement (or formally the “statement of cash flows”). The cash flow statement is broken down to operating, investing and financing activities to help the analyst assess where the cash came from and what it was spent on.
Interestingly, only starting in 1987 in the USA and in 1994 on international reporting standards, the publishing of these cash flow statements became mandatory (see here).
But what do cash flow statements tell that the earnings statement and the balance sheet cannot?
First of all, it’s not true that they cannot.
The cash flow statement is rather a bridge or a “translator” that explains and illustrates certain movements between the balance sheet and the profit and loss statement, focussing on where real cash was moved and how it was influenced.
If you’re more experienced and like doing several calculations in your head yourself, you will likely be able to also see potential dangers arising with a look at these two statements alone.
This “self-exploration” can be especially helpful if companies do not immediately release a cash flow statement together with their press release – or a heavily shortened one (some companies also release shortened balance sheets where they group certain positions together into one like all current assets where cash is part of).
This is allowed, as the full statements only have to be shown in the annual and quarterly reports (in the US) or even semi-annually in several countries like UK or France. Not all, but many companies release both on different dates.
The cash flow statement ist more precise by giving detailed information and it is structured in a cleaner way so that the necessary information can be grasped quicker, instead of having to keep several different positions in mind separately.

A crucial part of the cash flow statement is the working capital section.
The three most important positions to know and to look at are:
- inventories
- receivables (outstanding invoices to your customers whereby they already received their purchased products or services while you are still waiting for the cash to flow in)
- payables (outstanding invoices from your suppliers to you whereby you already received your purchased products or services, but haven’t paid your bills, yet)
They have a big influence on whether cash is tied up in the business or generated through sales. Even more so if you look at companies with physical products.
All these three are also positions on the balance sheet.
However, you would have to calculate the changes between reporting periods in your mind and add them together. The net results would have to be added (if working capital went down) or subtracted (if working capital went up) from net income – among others like depreciation and amortization, created or released provisions (capital put aside, but no effective cash movement) or also stock based compensation!
You see, this way it gets more complicated.
Note: There are also companies operating with a negative working capital. This is rather the case, when a company is so strong that it can afford to pay its own suppliers way later than it generates its own sales.
With a look at the cash flow statement you can see the changes immediately by reading from top to bottom.
As a further side-note: Being often under pressure to present decent results or to meet certain expectations as well as own priorly announced guidance figures, management has some playing room. They could pay their own bills a few days later (after the balance sheet date) or aggressively call in outstanding bills to customers (before the balance sheet date) in order to make cash flows look better than they truly are.
Self-explanatory, this game cannot be played forever, as at some point in time organic cash generation will be needed.
This is already going a bit too far, but keep this in mind that there is such a possibility.
It shows you that this section has a crucial role. Often, it is one thing what is being said and presented (read: highlighted) by management, while the true story is hidden in the numbers they “forgot” to talk about.

Now, the other thing to understand is the conversion of earnings into cash. This is what is meant by “quality earnings”.
A company can present strong earnings, but if cash flows are remarkably weak – especially several times in a row or over a longer period of time, not leveling out – then there is likely a problem under the hood.
A strong bottom line (results) without a corresponding cash generation is not only misleading, but can even be highly dangerous. It can reach from weak future performance to even fraud, if systematically done.
Take for example a company (I will discuss a concrete example based on this story in the next section) that just recently releases sales growth, together with more or less stable operating earnings. Earnings per share have been only slightly down.
A bit of margin pressure, but so what…
Management argues in the press release that the company has grown organically (on sales), but results were a bit overshadowed (they would not call it this way, of course) by higher operating and financing costs as well as changed consumer behavior, buying lower margin products. Also, there was some inventory build-up due to this.
A dividend was announced, but stock buybacks weren’t done, according to prior announced plans.
What at first glance might sound like okay-ish results, maybe a short-lived one-time event, in fact not only does not tell the whole truth, but it can be a masking of pretty unfavorable processes behind the curtain that can also tell you something about the next upcoming earnings! Or at least some potential dangers.
To be fair, management also lowered its guidance for the year.
But nonetheless, they didn’t focus enough on or explained in detail the reason for their “low-quality” earnings.
It is important to understand that operating or net earnings (whether adjusted or not) are not the same as cash flowing into the company!
Let us take a look at this example as it happened last week.
Dollar General – falling by 15% after results…
… and another nearly 10% since the first drop, making it more than 20% in a few days.
This is exactly what happened last week, after Dollar General (ISIN: US2566771059, Ticker: DG), a company I already briefly discussed in my article “Dollar stores with discounted prices, but expensive shares” (see here).
Back then, I warned about too high valuations as well as too aggressively leveraged balance sheets (for all discussed companies, not only DG), despite their actually promising business models with higher growth rates than the likes of Wal-Mart (ISIN: US9311421039, Ticker: WMT), effectively taking market share.
I really disliked the aggressive debt-financed buybacks back then, even surpassing cash flow generation.
Despite my cautiousness, the recent results were also somewhat (negatively) surprising even for me, showing that there are more serious problems under the hood.
The often portrayed picture as a good “recession-investment” is hard to keep up, now.

The described scenario above could e.g. mean that the company massively struggled to sell its products to customers which actually happened as DG’s inventories went up by 20% year-over-year (15% on a same-store basis, adjusting for newly opened stores).
However, higher inventories mean less cash flow as it is tied up in working capital.
But why is this problematic?
There is no guarantee that all inventories as held on the balance sheet will be able to get sold at the current value. So, the lower cash flow can be (does not have to, but can) a precursor to looming write downs – then, with a time lag, you will get massive one-time drops in earnings or even bottom line losses all together.
Low cash flows can be a forerunner for lower earnings to come, if working capital cannot be converted into cash.
And who says that these unsold inventories will be salable without the need to give discounts to get rid of them, especially in the case of seasonal, often higher margin articles?
Interested in garden furniture in the fall or winter, anyone?
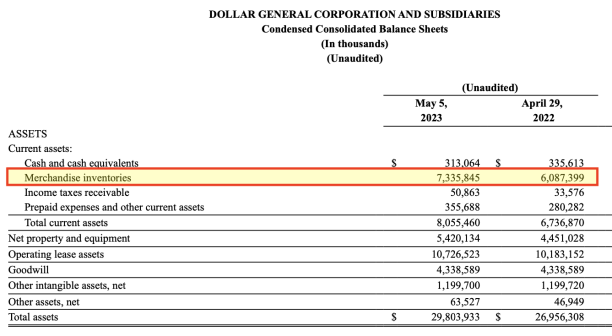
What might sound “not so dramatic” as physical inventories are part of the business model (between 20–25% of total assets, see above) and certainly not everything is perishable or unsalable at a later date, indeed could have and likely will have negative consequences.
The somewhat lower margins came from higher labor wages as well as changes in consumer buying patterns, as higher margin, but more discretionary products like seasonal articles or apparel were bought less, however, lower margin typical everyday consumables more, instead.
Now back to the cash flow issue. Think of domino effects.
Management did not “highlight” that operating cash flow was down by 58%. Nowhere in the press release (see here), can you find this figure. You have to calculate it yourself from the cash flow statement. They only mentioned the total number without giving more context.
I tend to argue that –58% in operating cash flows tells a totally different story than –0.7% in operating income or the –2.9% in EPS – both latter figures of course being headline numbers.
This is at the very minimum confusing. One could also say misleading – for those that don’t distinguish between “earnings” and the “quality of earnings”. Sure, inventories can be sold later and cash flow can jump back, outpacing earnings, again.
But the drop in cash flows brought other ramifications with it. Especially, if you look further than the headline numbers.
Here, you can see the big discrepancy between net earnings and operating cash flow. Besides unfavorable inventory movements, DG also had higher expenses. You will notice that last year’s cash conversion (difference between net income and operating cash flow) was way smaller than it is now.

About –3% in EPS as a headline number sounds like a small bump.
But due to operating cash flow being so low, it didn’t even cover capital expenditures. Any wonder management cut capital expenditure guidance for the whole year – after just one quarter (original guidance was in March)?
Won’t this affect future growth, at least in the short- to medium-term?

It does not require a separate explanation that there were no buybacks (at lower prices). But at prices above 200 USD, it was no problem. In the fourth quarter of the last fiscal year (until January), management even spend a full billion USD on buybacks – at the top as the stock stood at around 260 USD.
However, the dividend was still paid last quarter and a new one announced. Together with the investments into the business, cash flow fell short by 300 mn. USD.
New borrowings – in this case 500 mn. USD of which half was used for the repayment of matured debt – were necessary to finance these cash outflows.
In the last fiscal year, DG increased its total long-term debt from 4 bn. to 7 bn. USD at an average interest rate of about 5%. That’s 150 mn. USD more interest payments for as long as these bonds are outstanding – per year! And by the way, after the earnings release and while I was writing this Weekly, DG issued another 1.5 bn. USD in fresh new bonds with average coupons of 5.2–5.45% (see here).
Below, you see more of the cash flow statement – please have a look at the very last row, the cash interest paid. A rise of more than 100%, nearly a triple in a single year.

In the case of severe liquidity issues, the company can be forced to take on debt to meet its own payables like equipment leases or just bills from its own suppliers. Simply due to the lack of incoming cash.
Then there is also the topic of refinancing.
Due to weak cash generation – should it continue – and under the assumption that management will want to keep up the dividend (more negative press releases are not welcome), it is unlikely that debt will be effectively paid back. Refinancing means higher interest which means less earnings and cash flows – and less cash.
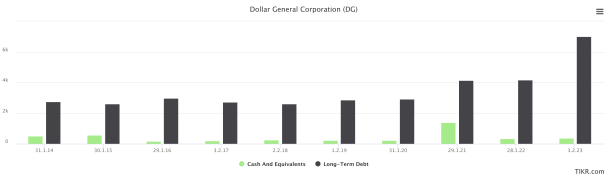
The final charts show you the evolution of long-term debt and cash as well as the debt maturity overview.
Not a pretty nice picture. The only positive is that the debt is structured over many years and some of it over decades. But the high, locked-in interest rates stay and every new refinancing only increases yearly interest payments.

Above, you can see most bonds still having sub 5% or even 4% yields. Should interest rates stay higher for longer – you should at least be prepared for such an outcome – then every new round of refinancing will only increase yearly interest expenses, thus having a negative impact on the bottom line and cash flows.
Doesn’t this read in a completely different way than the earnings press release?
But certainly, after the massive drop, the valuation is attractive. Is it?
The PE ratio – another darling – is around 14–15x. But you don’t factor in debt. With net financial debt (without leases), the enterprise value is around 42 bn. USD – with the new debt after the reporting period even higher.
Which cash flow (ideally, free cash flow) do you want to put against it?
I have difficulties here. Even during 2022, cash flow was already under pressure. Free cash flow in 2022 was just 420 mn. USD. A multiple of 100x – not cheap. The record free cash flow from the year 2021 – 2.8 bn. USD – would still give us an EV / FCF multiple of 15x.
This is neither extraordinarily cheap nor likely that such a high cash flow will be achieved again, especially having all these uncertainties. The dividend yield of just 1.5% isn’t exciting, either.
This could be a rather extreme example. But do yourself the favor and check the balance sheets of your investments. Are the reported earnings of higher or lower quality?
Conclusion
Reported earnings should not automatically taken at face value – especially not the headline numbers as they are highlighted for a purpose.
You should compare reported earnings with the (free) cash flow generation.
Better be cautious or even avoid companies with high valuation multiples, high debt and weak cash flow generation.
By becoming a Premium or Premium PLUS Member, you get instant access to all my already published research reports as well as several updates.
Likewise, you qualify for eight, respectively three more exclusive reports with my best investment ideas plus updates on the featured businesses over the next twelve months.
Premium PLUS Members also get access to all Premium publications.